How Your Brain Decides What to Look At
Our eyes have the ability to absorb information at a rate of about one gigabit per second. That means a single eye can handle approximately 1.6 gigabits of information per second with the help of 6 million cone photoreceptor cells which are present inside it. But interestingly our ability to process all this information is limited. Because humans are limited to process about 10 bits per second. That roughly translate to a ratio of 100,000,000 to 1.
Cones Humans have three classes of cones (L, M, S) that each differ in spectral sensitivity and 'prefer' photons of different wavelengths. For example, the peak wavelength of the S-cone's spectral sensitivity is approximately 420 nm, so it is more likely to absorb a photon at 420 nm than any other wavelength. Light of a longer wavelength can also produce the same response from an S-cone, but it would have to be brighter to do so.
This often makes human unaware of changes in our environment that they are not paying attention to. This process is known as change blindness. The function of the brain is to solely act like a filter, sifting through large amounts of data to focus on a single important signal while ignoring background noise. This situation is also similar to trying to listen to one conversation in a noisy room, a problem known as the Cocktail Party Problem.
Change blindness is a perceptual phenomenon that occurs when a change in a visual stimulus is introduced and the observer does not notice it. People's poor ability to detect changes has been argued to reflect fundamental limitations of human attention. Wikipedia You can also refer to this YouTube video for a practical demonstration.
Cocktail Party Problem
The Cocktail Party Problem describes how the brain can pick out a single signal from a noisy environment filled with competing sounds. This term originally referred to a listener's ability to focus on one speaker in a crowded room. Now, it also refers to the brain's ability to selectively focus on certain sounds or sights, even with many distractions.
For the brain to formalize a single thought or action it must sift through many sensory inputs at the same time called as attentional bottleneck. To make the decision making sustainable, the brain uses several computational mechanisms to filter out noise under the framework of active inference. These include:
- Precision Optimization: The brain assigns precision to internal representations of sensory data, which is conceptualized as attention. When the brain focuses on a signal, it optimizes the precision of the mappings between internal beliefs and specific sensory observations.
- Top-Down Filtering: The brain uses generative models to map internal goals and expectations to incoming data, which allows it to suppress noise before it reaches conscious processing. This process involves pruning away unlikely scenarios or irrelevant background distractors.
- Noise Suppression: The brain's ability to suppress noise is challenged when the precision assigned to unattended background noise is only slightly lower than that of the target signal, which can cause errors in perception because irrelevant information can influence the brain's internal beliefs.
Hierarchical Organization
The information flow of visual input is organized in hierarchical way. The ventral stream is the visual pathway in the brain responsible for recognizing the form, shape, and identity of objects and it starts in early visual areas like $V1$ and $V2$. From there, it moves through $V4$ and ends up in the inferior temporal cortex ($IT$), where the brain forms complex representations of objects.
This sequence can be written as:
$V1 \rightarrow V2 \rightarrow V4 \rightarrow IT$
At each stage, brain's processing becomes more abstract. Area's such as $V1$ and $V2$ are close to the retinal image's layout and both can detect basic patterns and features, therefore these are not some mere transmission block rather is have it's own processing ability. Moving forward neurons start to respond to larger parts of the visual field. For example, neurons in $V2$ typically respond to areas $22–33$ times larger than those in $V1$. This pattern continues in areas like V4. By the time information reaches the inferior temporal cortex, neurons respond to complex shapes and whole objects. They often do this in a way that is unaffected by the object's position or small changes in its appearance.
The possible question of where is $V3$ is another question. $V3$ is more strongly associated with motion and global form processing, often feeding into both ventral and dorsal streams. Reorganizing: V1 → V2 → (V3/VP) → V4 → IT, with V3 acting as a mid‑level station that routes information to multiple pathways, which is why many diagrams skip it when focusing only on object‑recognition.
This architecture helps solving the "Cocktail Party Problem" for the eyes through a process called biased competition. When multiple objects are within the same receptive field, they compete with each other for neural representation by suppressing each other's signals. As you move up the ventral stream, the receptive fields get larger. This means the competition is weakest in V1, where the receptive fields are small and can only capture one stimulus at a time. In areas like V4 and TEO, the competition is strongest because a single receptive field can cover many objects. V4 and TEO play a key role in filtering out distractions. The brain resolves this competition by introducing biases, such as focusing attention on a particular object or noticing how prominent a stimulus is, to favor one signal over others.
Feature Integration and Object Identification
Feature Integration Theory, developed by Anne Treisman and Garry Gelade in 1980, explains how the brain creates logical objects from raw sensory input in two stages. The first stage is preattentive, where the brain automatically registers basic features such as color, shape, orientation, motion, and size simultaneously across the visual field, mainly in early visual areas like V1. At this stage, these features exist on their own and the brain has not yet determined which features belong to which object.
The second stage is focused attention, where the brain combines separate features into whole objects. This stage requires attention to be directed to a specific location in a "master map" of the visual field, often guided by prior knowledge and goals. When attention successfully combines features, the brain forms "object files" that represent unified entities. If attention is disrupted, such as in Bálint's syndrome, features from different stimuli can be combined incorrectly into illusory conjunctions, showing how important attention is for identifying objects.
Desimone and Duncan's 1995 theory, known as Biased Competition Theory, expands on this idea by describing perception as a competitive process. In the visual field, multiple stimuli compete for neural representation because neurons can only process a limited amount of information. When several objects are within a single neuron's receptive field, they suppress each other, and one representation dominates the others. Attention affects this competition by introducing biases. Top-down signals, such as focusing on a specific location or having a task-related goal, give the target stimulus more importance, allowing it to overcome the suppressive effect of distractions.
This competition and its modulation by attention increase at each stage of the visual hierarchy. In V1, receptive fields are small, so stimuli seldom overlap within the same neuron's receptive field, and competition is relatively weak. In V4 and IT, receptive fields are larger and often include multiple objects, resulting in stronger suppressive interactions. At this point, attention has its strongest effect, filtering out unwanted information from nearby distractors and allowing the attended object to dominate the neural response.
Feature Integration Theory is supported by key experimental findings such as visual search tasks and illusory conjunctions. In feature search, targets stand out because only one basic feature differs from the background, relying mainly on the preattentive stage. In conjunction search, observers must scan items one by one, because the target is defined by a combination of features, which requires focused attention and binding. Illusory conjunctions during brief presentations or in patients with Bálint’s syndrome show that objects fail to form correctly when attention is unavailable to link features. These findings show how feature detection and attentional control work together to enable object identification in natural scenes.
Attentional Mechanisms
To solve the "Cocktail Party Problem"- the brain uses two types of attention processes. One is driven by the stimulus itself, known as bottom-up or exogenous biasing. The other is driven by internal goals and expectations, known as top-down or endogenous biasing.
Bottom-Up (Exogenous) Processing
Bottom-up attention is driven by saliency, automatically drawing attention to items that stand out from their surroundings due to physical properties like a red ball in a field of green grass. This process has several key characteristics:
- Automatic "pop-out" occurs when basic features such as color, orientation, and movement are processed automatically and in parallel across the visual field, making salient targets stand out without effort.
- The neural basis for saliency appears as early as $V1$, where the brain computes contrast signals from incoming visual input.
- Bottom-up processing is used to simulate basic synthetic attention in computational models because it relies on well-defined mathematical contrasts in the stimulus, making it the primary mechanism for this purpose.
Top-Down (Endogenous) Processing Top-down attention is driven by goals. Involves actively decide what to look for based on tasks, memories, or intentions. This type of attention has several key aspects:
- Neural "Priming": The brain has an "attentional template" for the target, and it sends feedback signals to the visual cortex. This increases activity in relevant areas before the target appears, preparing the system.
- The source of this bias is mainly the frontoparietal attention network, which includes the frontal eye fields and the superior parietal lobule.
- Feature integration is also important. Top-down attention helps combine independent features into coherent objects. By focusing on specific locations, it prevents the mistaken combination of features from different objects, known as illusory conjunctions.
Itti-Koch Saliency Model
The Itti-Koch Saliency Model is a foundational computational model for visual attention in computer vision and cognitive neuroscience. Laurent Itti and Christof Koch proposed this model, which simulates how the human visual system quickly identifies important regions in a scene before we consciously recognize them. The model doesn't process every pixel equally. It focuses on areas that stand out from their surroundings, which are called visually "salient" areas. This concept is based on the brain's ability to selectively focus on certain parts of the visual information it receives, prioritizing them for closer examination.
The model detects what stands out in an image by looking at color, intensity, and orientation. It identifies areas with colors that are very different from the colors around them. The model also measures brightness contrast, which helps it notice objects that are much brighter or darker than their backgrounds. It looks for edges and lines that go in specific directions, like horizontal, vertical, or diagonal. The model analyzes these features at different scales and puts them together to create a map that shows where people are likely to look first. This model has had a big impact on robotics, image processing, autonomous systems, and the development of attention mechanisms in artificial vision systems.
Building/Implementation
When humans look at a scene, we do not process every pixel equally. Some regions immediately attract attention, like;
- Bright object in a dark room
- Red flower in green grass
- Vertical pole in a field of horizontal lines
So before recognizing what an object is, the visual system first decides where to look. This process is called visual attention. The Itti-Koch Saliency Model attempts to reproduce this behavior computationally. Instead of recognizing objects, it identifies regions that stand out from their surroundings.
Our goal: Image $\rightarrow$ Saliency map
Saliency map is a heatmap version of the image
We first take the picture and convert it to RGB format, then build it's intensity map. Given the image:
Step 1: Represent the Scene at Multiple Scales
Objects can appear at different sizes. A small red dot and a large red wall can both attract attention, but they exist at different spatial scales. To analyze the image at multiple scales, we build a Gaussian pyramid. Starting from the original image, each level is repeatedly blurred and down sampled:
Level 0 → Original image
Level 1 → Smaller and blurrier
Level 2 → Smaller and blurrier
...
Level 8 → Very coarse representation
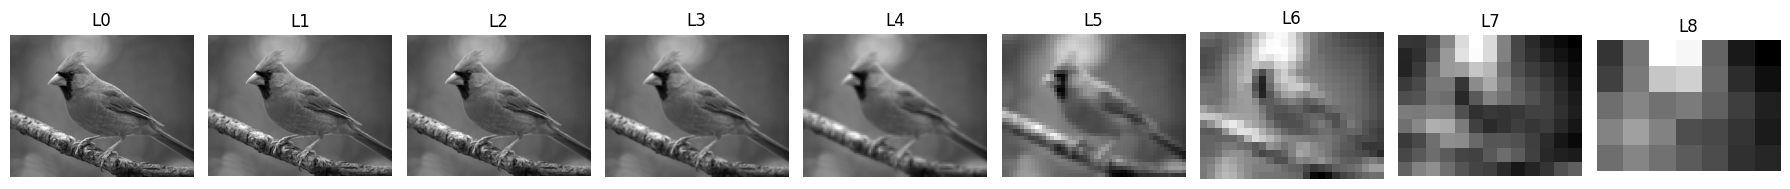
Each level contains less detail than the previous one but preserves the overall structure of the scene. This allows the model to compare local information with broader context.
Step 2: Detect Regions That Differ From Their Surroundings
The core mechanism of the model is the center-surround comparison. For a given pyramid level, a finer-scale image acts as the center, while a coarser-scale image acts as the surround.
The model asks: "Is this region different from its neighborhood?"
To answer this, the surround image is resized to match the center image and the absolute difference is computed.
Center − Surround = Feature Map
Bright regions in the resulting map indicate locations that differ significantly from their surroundings.
This operation is performed across multiple scale pairs (respective to the gaussian pyramid we build):
(2,5)
(2,6)
(3,6)
(3,7)
(4,7)
(4,8)
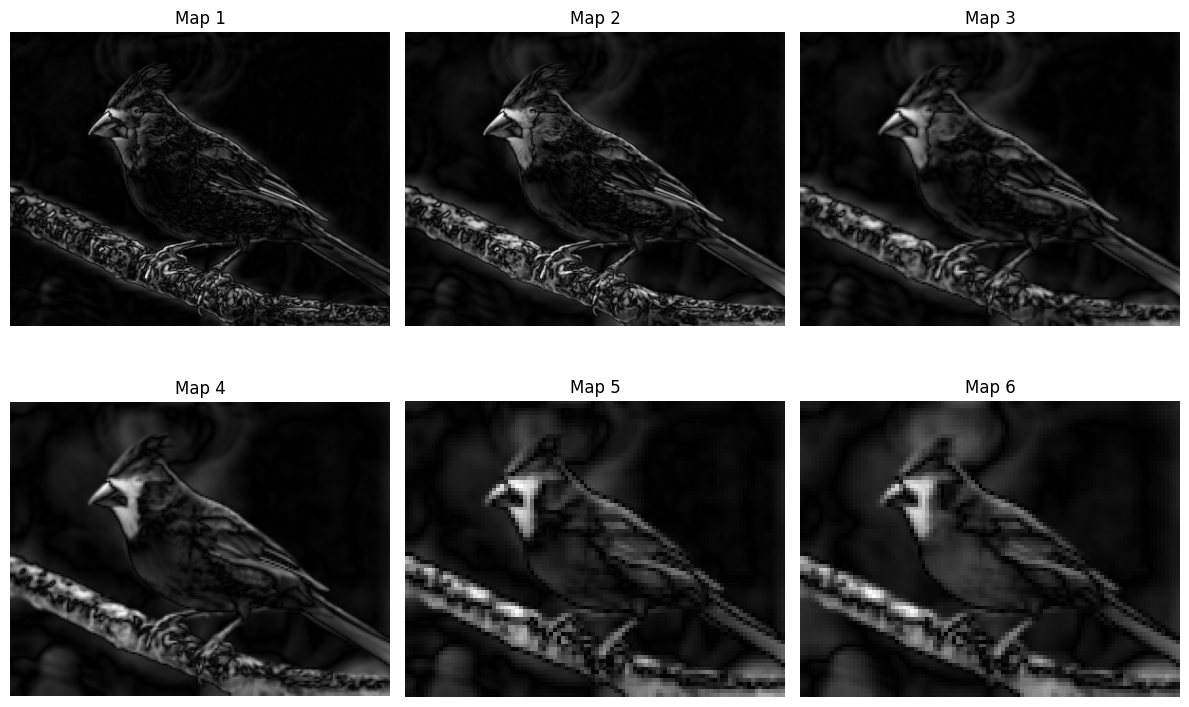
Each pair produces a feature map that captures saliency at a different scale.
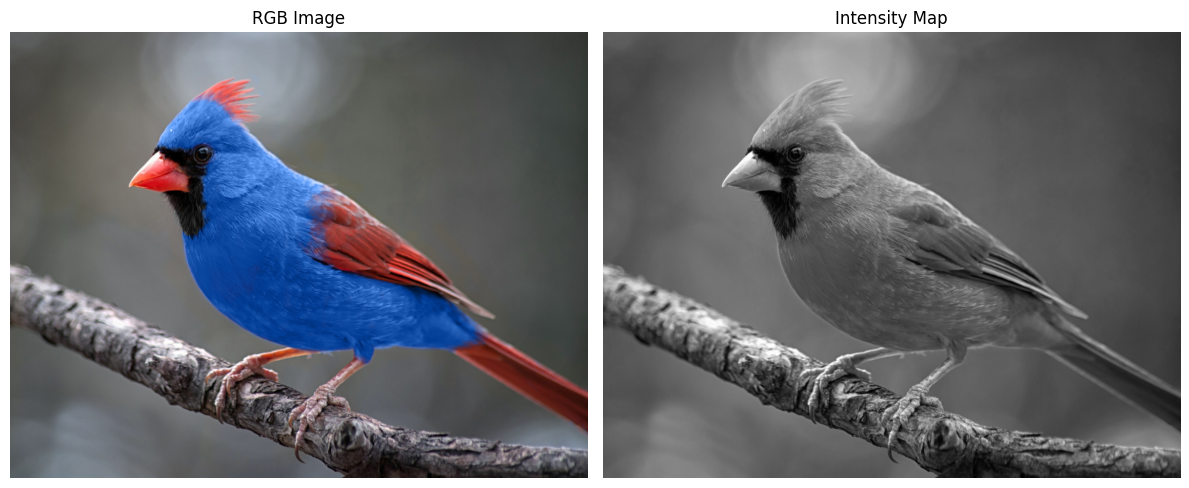
Step 3: Intensity-Based Attention
One source of attention is brightness. Humans naturally notice bright objects in dark environments and dark objects in bright environments. To model this behavior, the RGB image is converted into an intensity image:
Intensity = (R + G + B) / 3
The intensity image is then processed through:
- Gaussian pyramids
- Center-surround comparisons
- Feature-map normalization
This produces multiple intensity feature maps. Each feature map answers: "Which regions stand out in brightness at this scale?"

The feature maps are then combined into a single Intensity Conspicuity Map. This map summarizes brightness-based attention across all scales.
Step 4: Color-Based Attention
Brightness alone is not enough. A red bird on green leaves may have similar brightness to its surroundings while still being visually obvious. To model color attention, the image is transformed into biologically inspired opponent channels. Instead of processing RGB directly, the model computes:
Red
Green
Blue
Yellow
and then constructs two opponent pairs:
Red ↔ Green
Blue ↔ Yellow
These pairs mimic color-opponent mechanisms found in the human visual system.
The model computes:
RG = |Red - Green|
BY = |Blue - Yellow|
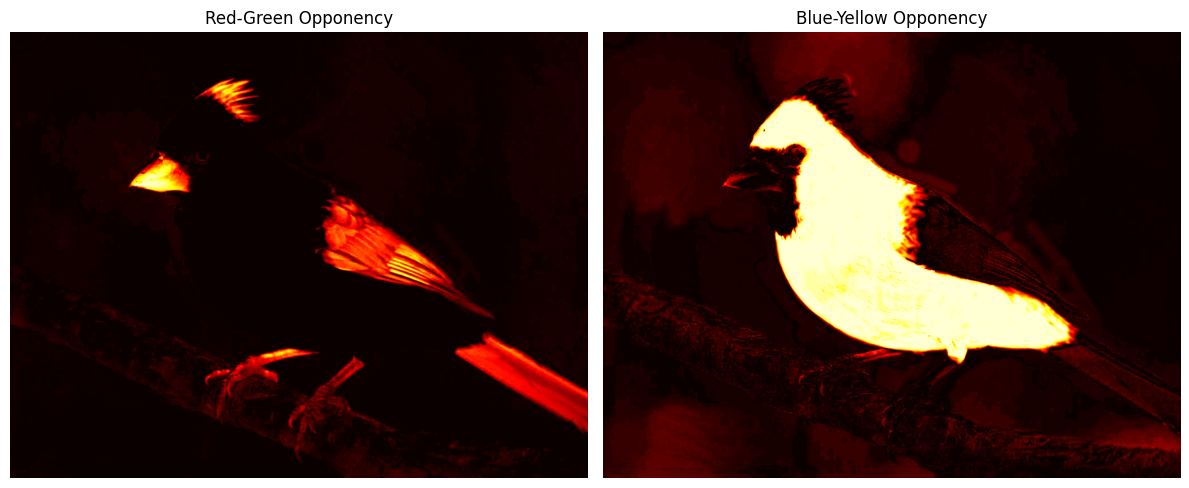
Large values indicate strong color contrast.
Both RG and BY channels undergo:
- Gaussian pyramid construction
- Center-surround comparison
- Feature-map normalization
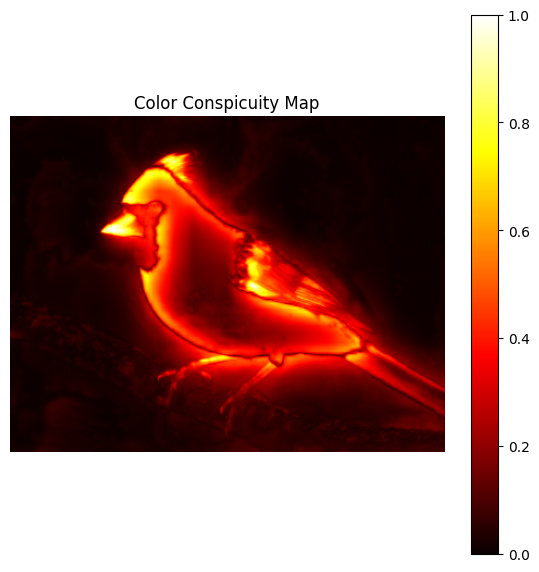
The resulting feature maps are fused into a single Color Conspicuity Map. This map highlights regions that stand out because of color differences.
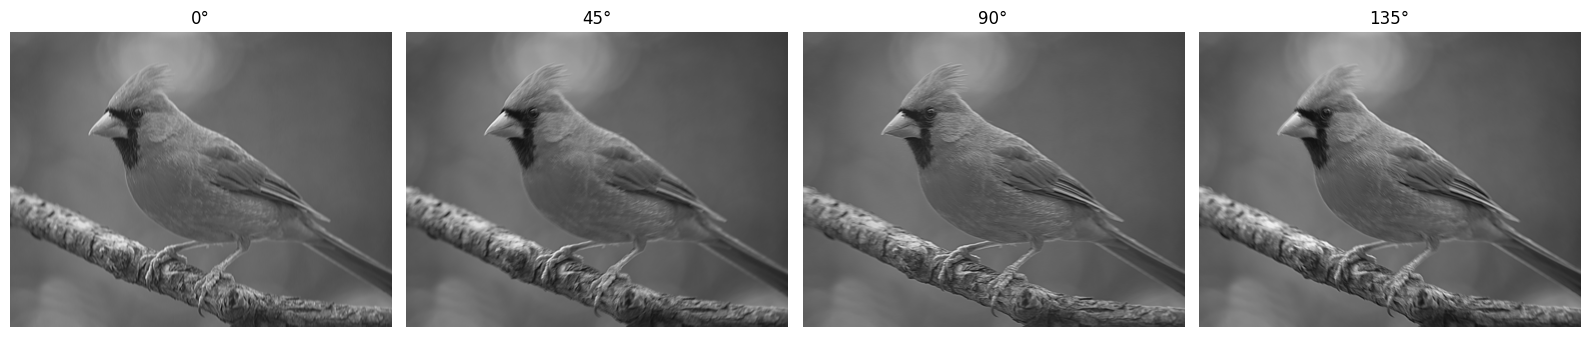
Step 5: Orientation-Based Attention
Humans are highly sensitive to edges and line orientations. A vertical object among horizontal structures immediately attracts attention. To model this behavior, the system uses Gabor filters. A Gabor filter responds strongly to structures aligned with a specific orientation. Four orientations are used:
0°   (horizontal)
45°
90°  (vertical)
135°
Each filter produces an orientation response image. These responses indicate where a particular edge direction exists within the scene.
Each orientation response is processed through:
- Gaussian pyramids
- Center-surround comparisons
- Feature-map normalization
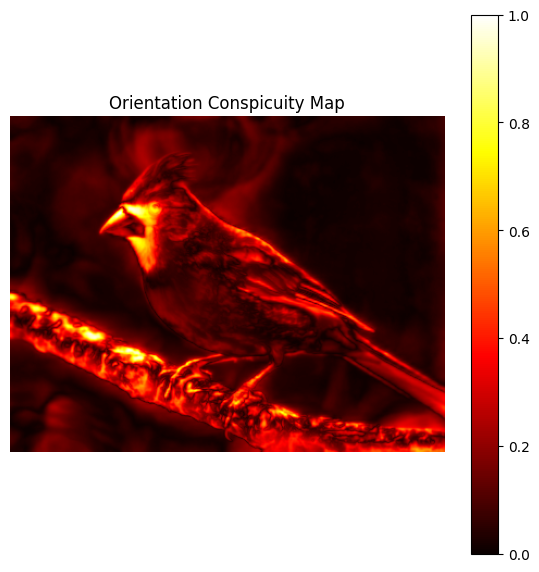
The resulting feature maps are fused into a single Orientation Conspicuity Map. This map highlights regions whose edge structure differs from their surroundings.
Step 6: Why Normalize Feature Maps?
Not all feature maps are equally useful. Consider two cases:
Map A
One bright peak
Everything else dark
Map B
Everything moderately bright
Map A provides a clear attention target.
Map B suggests that everything is important, which is not useful for directing attention.
To emphasize meaningful attention signals, each feature map is normalized and weighted according to how strongly its most salient regions stand out from the rest of the map. This suppresses noisy or uniformly active maps while amplifying maps containing strong isolated peaks.
Step 7: Conspicuity Maps
At this point the model has generated many feature maps. For example:
Intensity:
6 feature maps

Color:
12 feature maps

Orientation:
24 feature maps
Managing all of these independently would be difficult. Instead, the feature maps within each channel are combined into a single summary map.
Intensity Feature Maps
            ↓
Intensity Conspicuity Map

Color Feature Maps
            ↓
Color Conspicuity Map

Orientation Feature Maps
            ↓
Orientation Conspicuity Map
Each conspicuity map represents attention generated by one visual feature type.
Step 8: Construct the Final Saliency Map
The three conspicuity maps are combined:
Intensity + Color + Orientation
The combined result is normalized once more to produce the final saliency map. Bright pixels indicate locations that attract attention according to multiple visual cues. The model is not identifying objects.
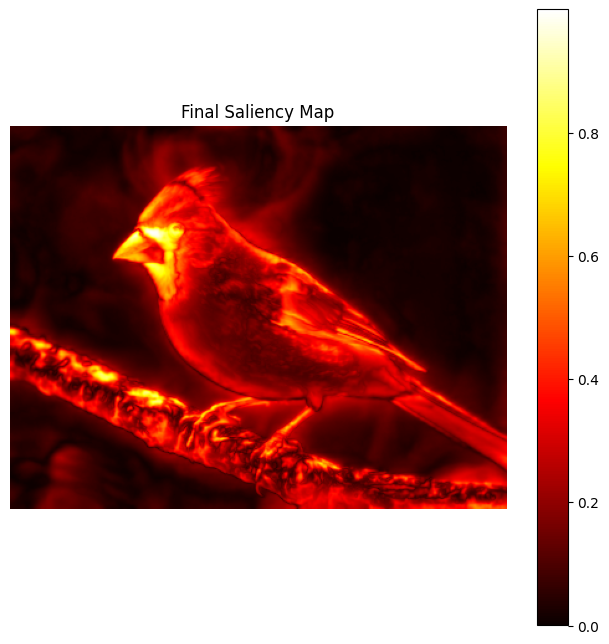
Instead, it is estimating: "Where should the visual system look next?"
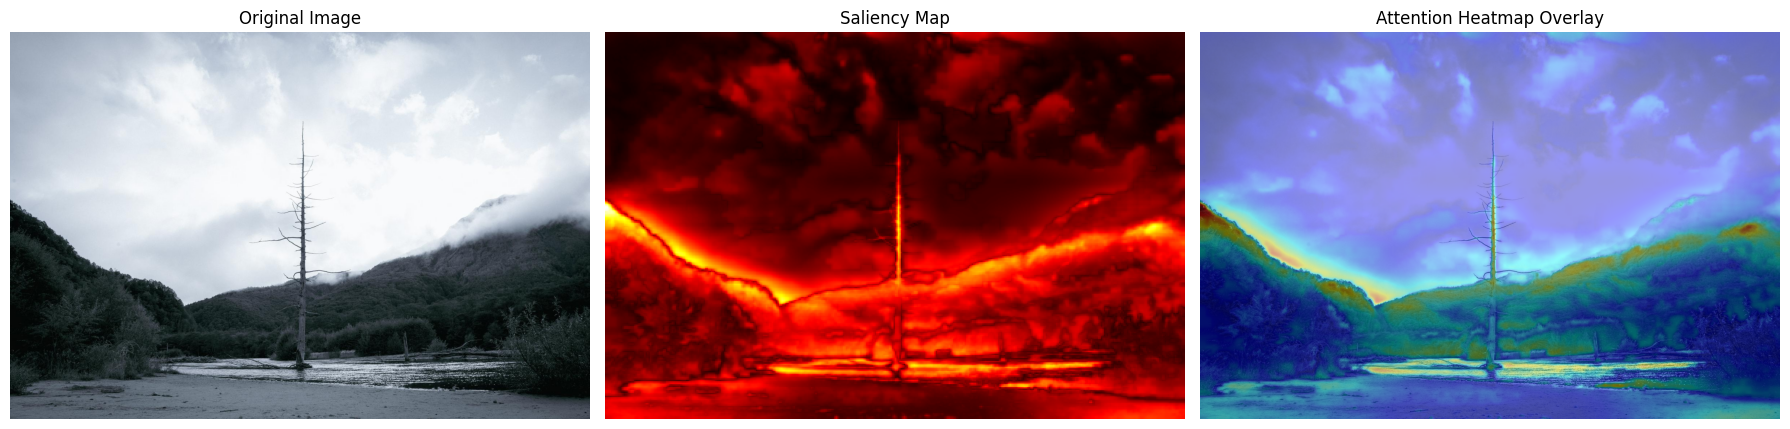
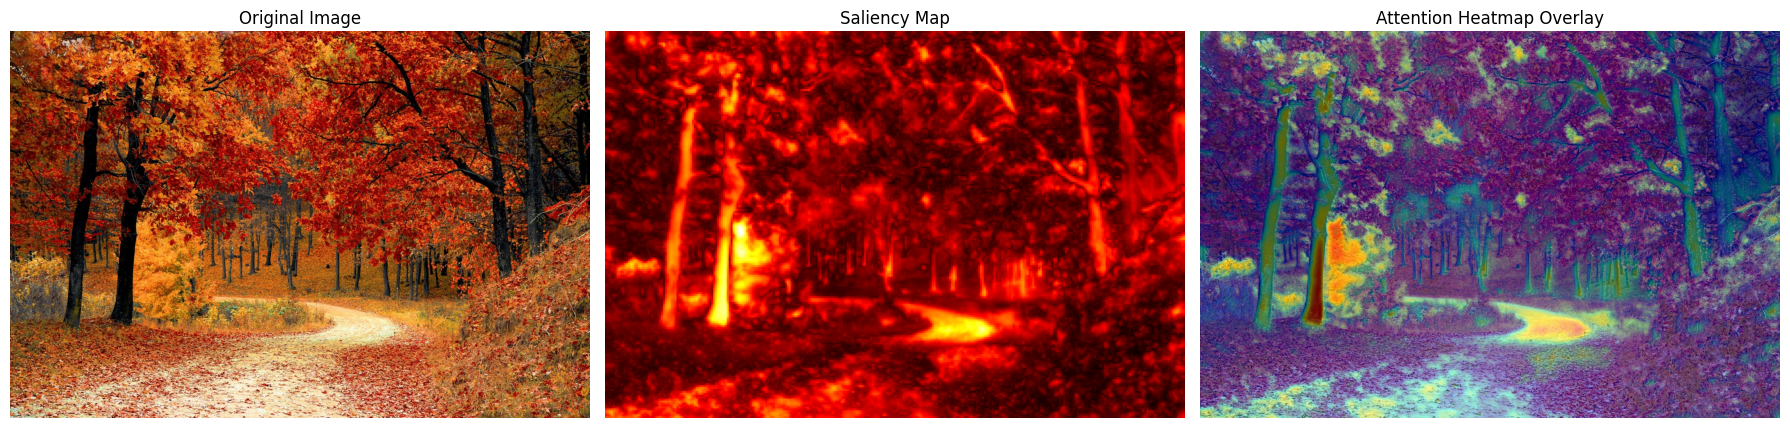
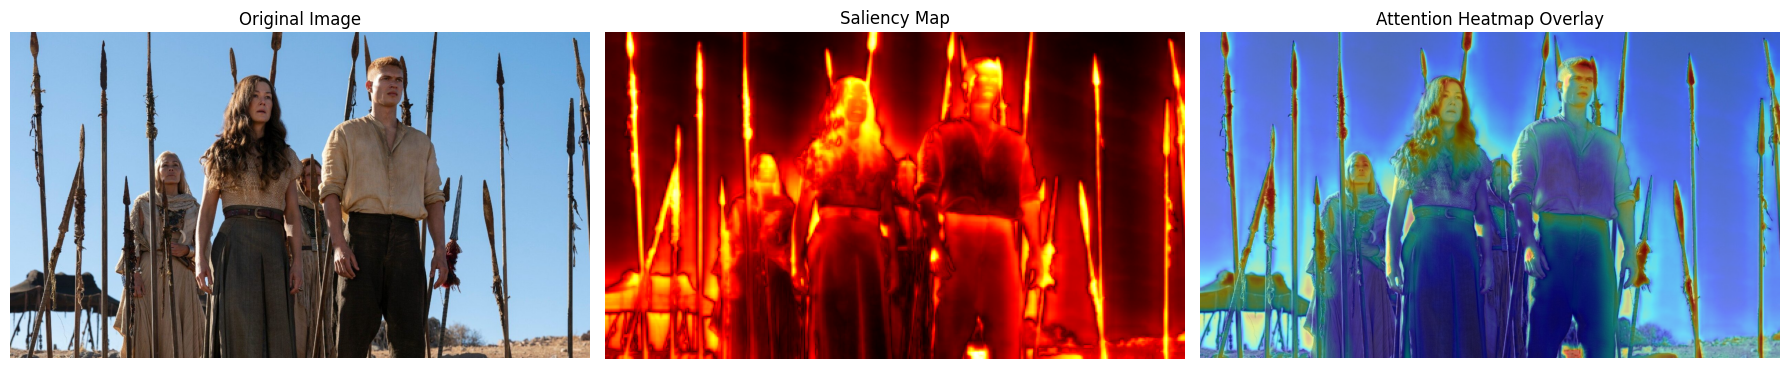
Step 9: Visualizing Attention
The final saliency map is converted into a heatmap and overlaid on the original image. Regions receiving high attention appear brighter and warmer.
The visualization typically contains three views:
- Original image
- Saliency map
- Attention overlay
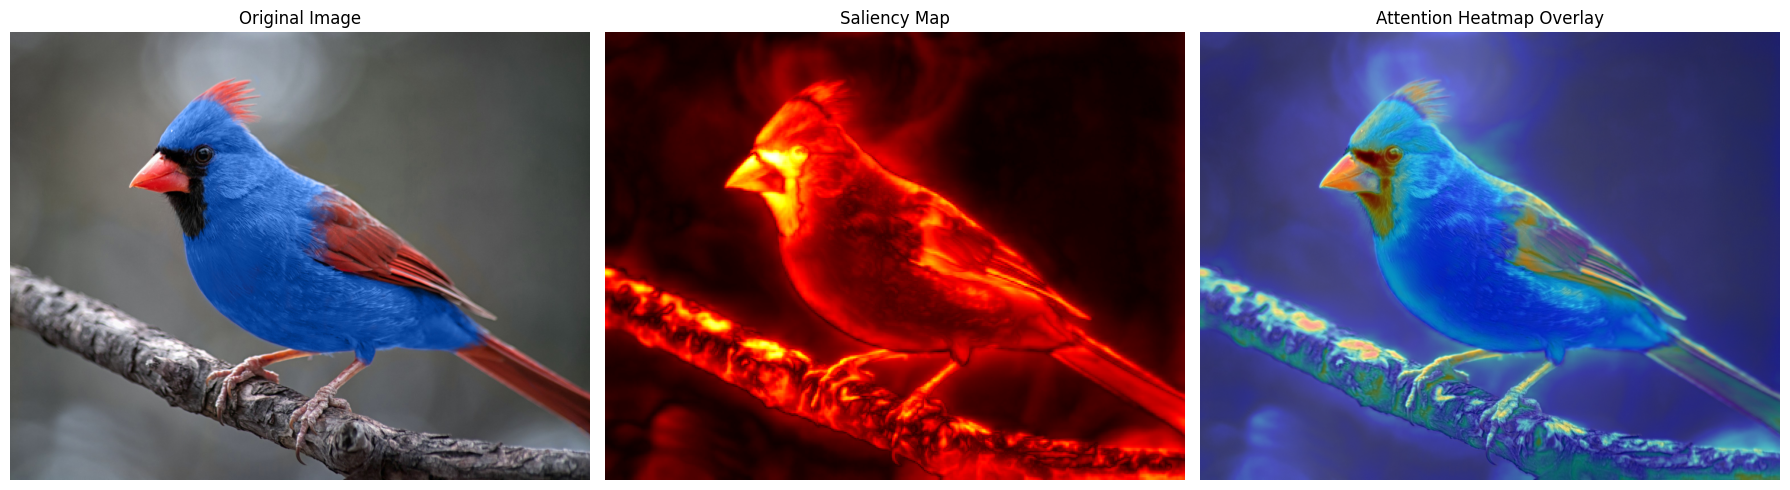
This makes it easy to understand which parts of the scene are attracting attention and why.
Result